Data Analytics for Events
Transform raw event data into actionable insights. Track attendance, monitor foot traffic, measure engagement, and generate post-event reports that prove ROI and guide future planning.
1M+
Data Points Processed
Real-Time
Dashboard Updates
100%
Data Ownership
Three steps to data-driven events
From data collection to actionable reports, CrowdPass handles the entire analytics pipeline automatically.
Connect Data Sources
CrowdPass automatically collects data from check-ins, access control scans, session attendance, lead retrieval, and survey responses. No manual setup required.
Monitor Live
Watch real-time dashboards during your event to track attendance trends, zone occupancy, and engagement metrics as they happen.
Generate Reports
After your event, generate comprehensive reports with custom filters. Export data in multiple formats for stakeholder presentations and future planning.
Everything you need to measure event success
Real-time dashboards, heatmaps, and custom reports in one platform.
Frequently Asked Questions
Why Event Data Analytics Matter More Than Ever
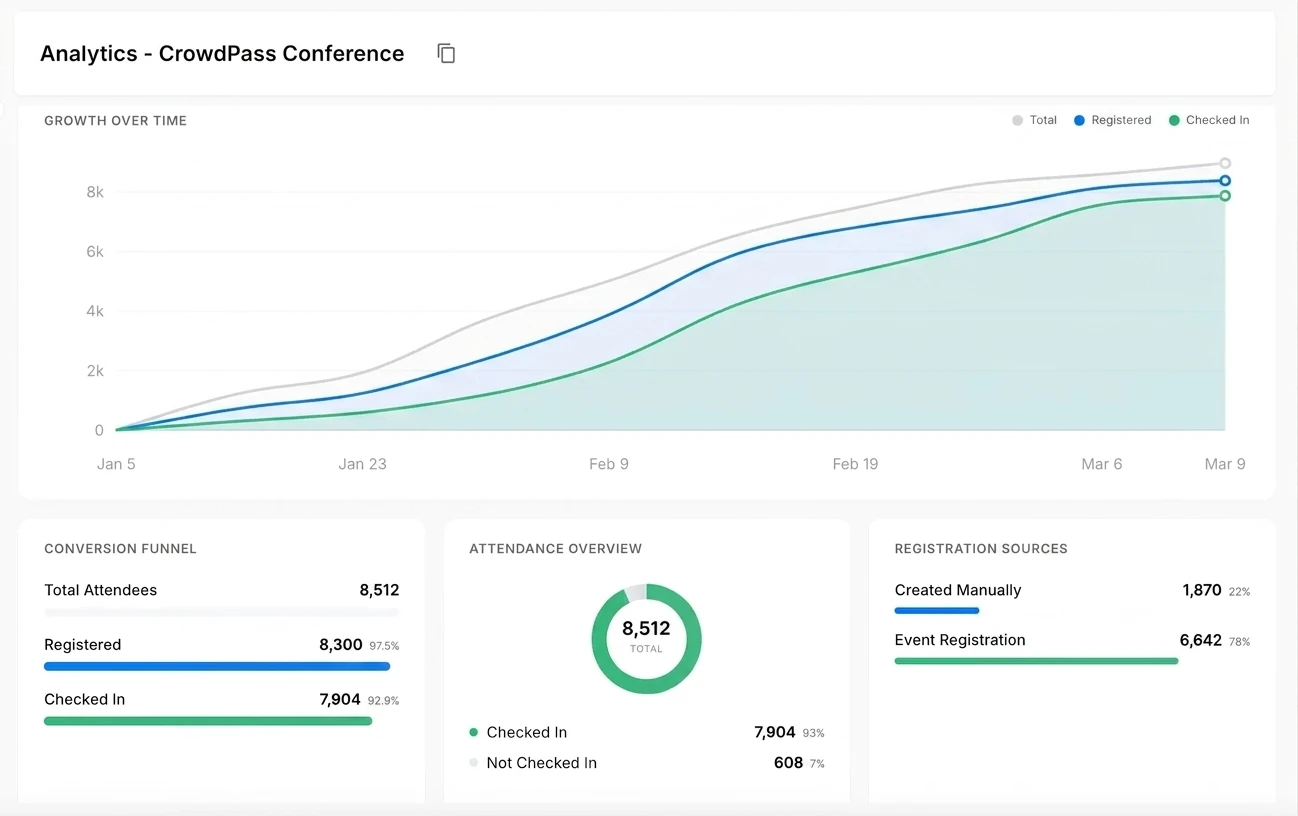
Event data analytics turn raw check-in counts and scan logs into decisions you can act on before, during, and after your event. Without analytics, organizers rely on anecdotal feedback and rough headcounts to judge success. With a proper event reporting dashboard, you can see exactly how many attendees arrived in each time window, which sessions hit capacity, where foot traffic stalled, and which sponsors generated the most leads. That level of detail changes the conversation with stakeholders from “we think it went well” to “here are the numbers.”
CrowdPass collects data from every touchpoint automatically. When attendees check in through the registration system, scan their badge at an access control checkpoint, or tap to exchange contact information via lead retrieval, each interaction feeds into a unified analytics layer. There is no manual CSV merging, no cross-referencing spreadsheets from different vendors. One platform captures everything and presents it in a single dashboard.
Real-Time Event Analytics During Your Event
Real-time event analytics give operations teams the ability to respond to problems as they develop rather than discovering them in a post-mortem. If a particular entry gate is processing attendees slower than expected, the live dashboard surfaces the bottleneck so you can redirect staff or open additional lanes. If a breakout room reaches capacity 20 minutes before a session starts, you see it in time to arrange overflow seating or a live stream. These are operational decisions that directly affect attendee satisfaction, and they are only possible when data arrives in real time rather than in a report two weeks later.
The same real-time data powers sponsor-facing dashboards. Exhibitors can log in to see how many leads their booth captured hour by hour, compare performance against the previous day, and identify peak traffic windows. Giving sponsors access to their own data builds trust, simplifies post-event reporting, and makes the renewal conversation easier because the numbers speak for themselves.
Attendance Tracking and Post-Event Reporting
Attendance tracking at the session level is one of the most requested features from conference organizers, and for good reason. Knowing that 1,200 people registered for a keynote is useful, but knowing that 940 actually showed up, 780 stayed for at least 30 minutes, and 620 were still in the room at the close tells a much richer story. CrowdPass captures entry and exit timestamps so you can calculate true dwell time, not just badge scans at the door. After the event, all of this data is available in exportable reports that break down attendance by session, day, attendee type, and custom segments. You own the data completely and can export it in CSV, Excel, or JSON at any time.
Ready to unlock your event data?
Join thousands of event professionals who use CrowdPass analytics to measure success, prove ROI, and plan smarter events.